Monitoring & Improvement
Monitor how your ESG data evolves over time and use insights to improve your work.
What is this module?
This module is where you:
- See performance - View charts and simple summaries of your data.
- Follow trends - Understand how key indicators are moving.
- Use insights - Read insight cards that highlight issues and opportunities.
What you can see here
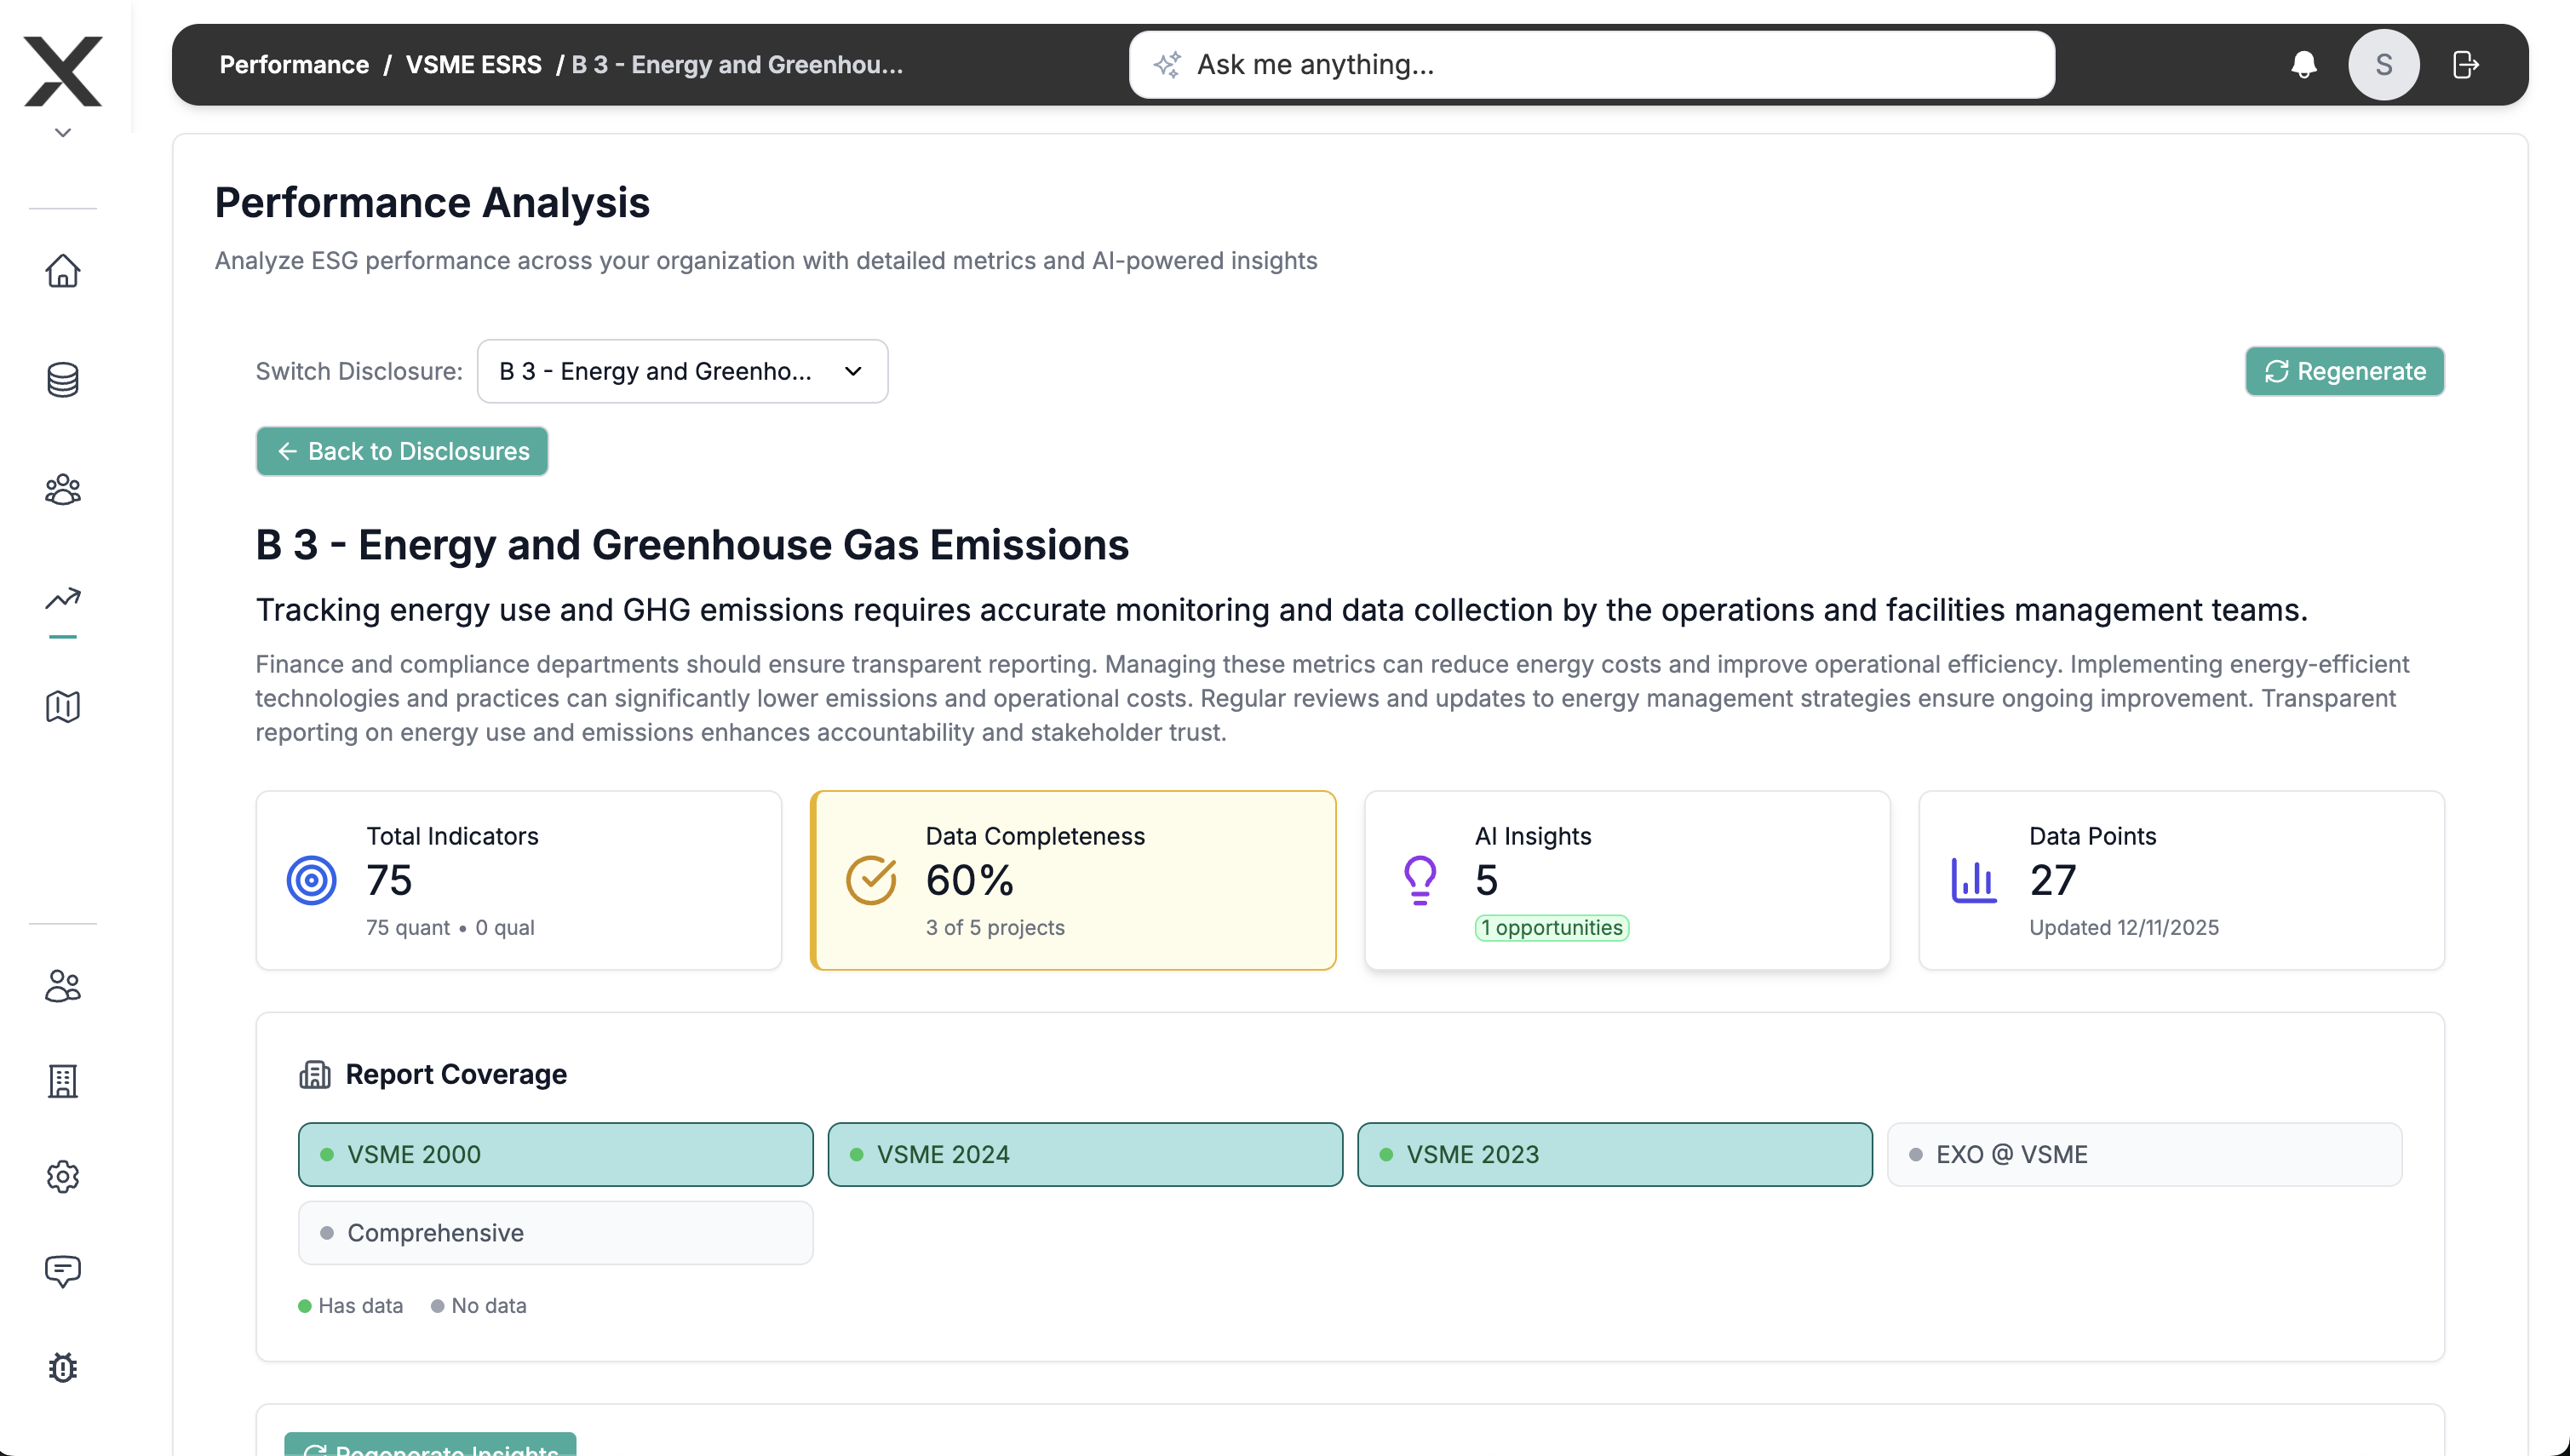
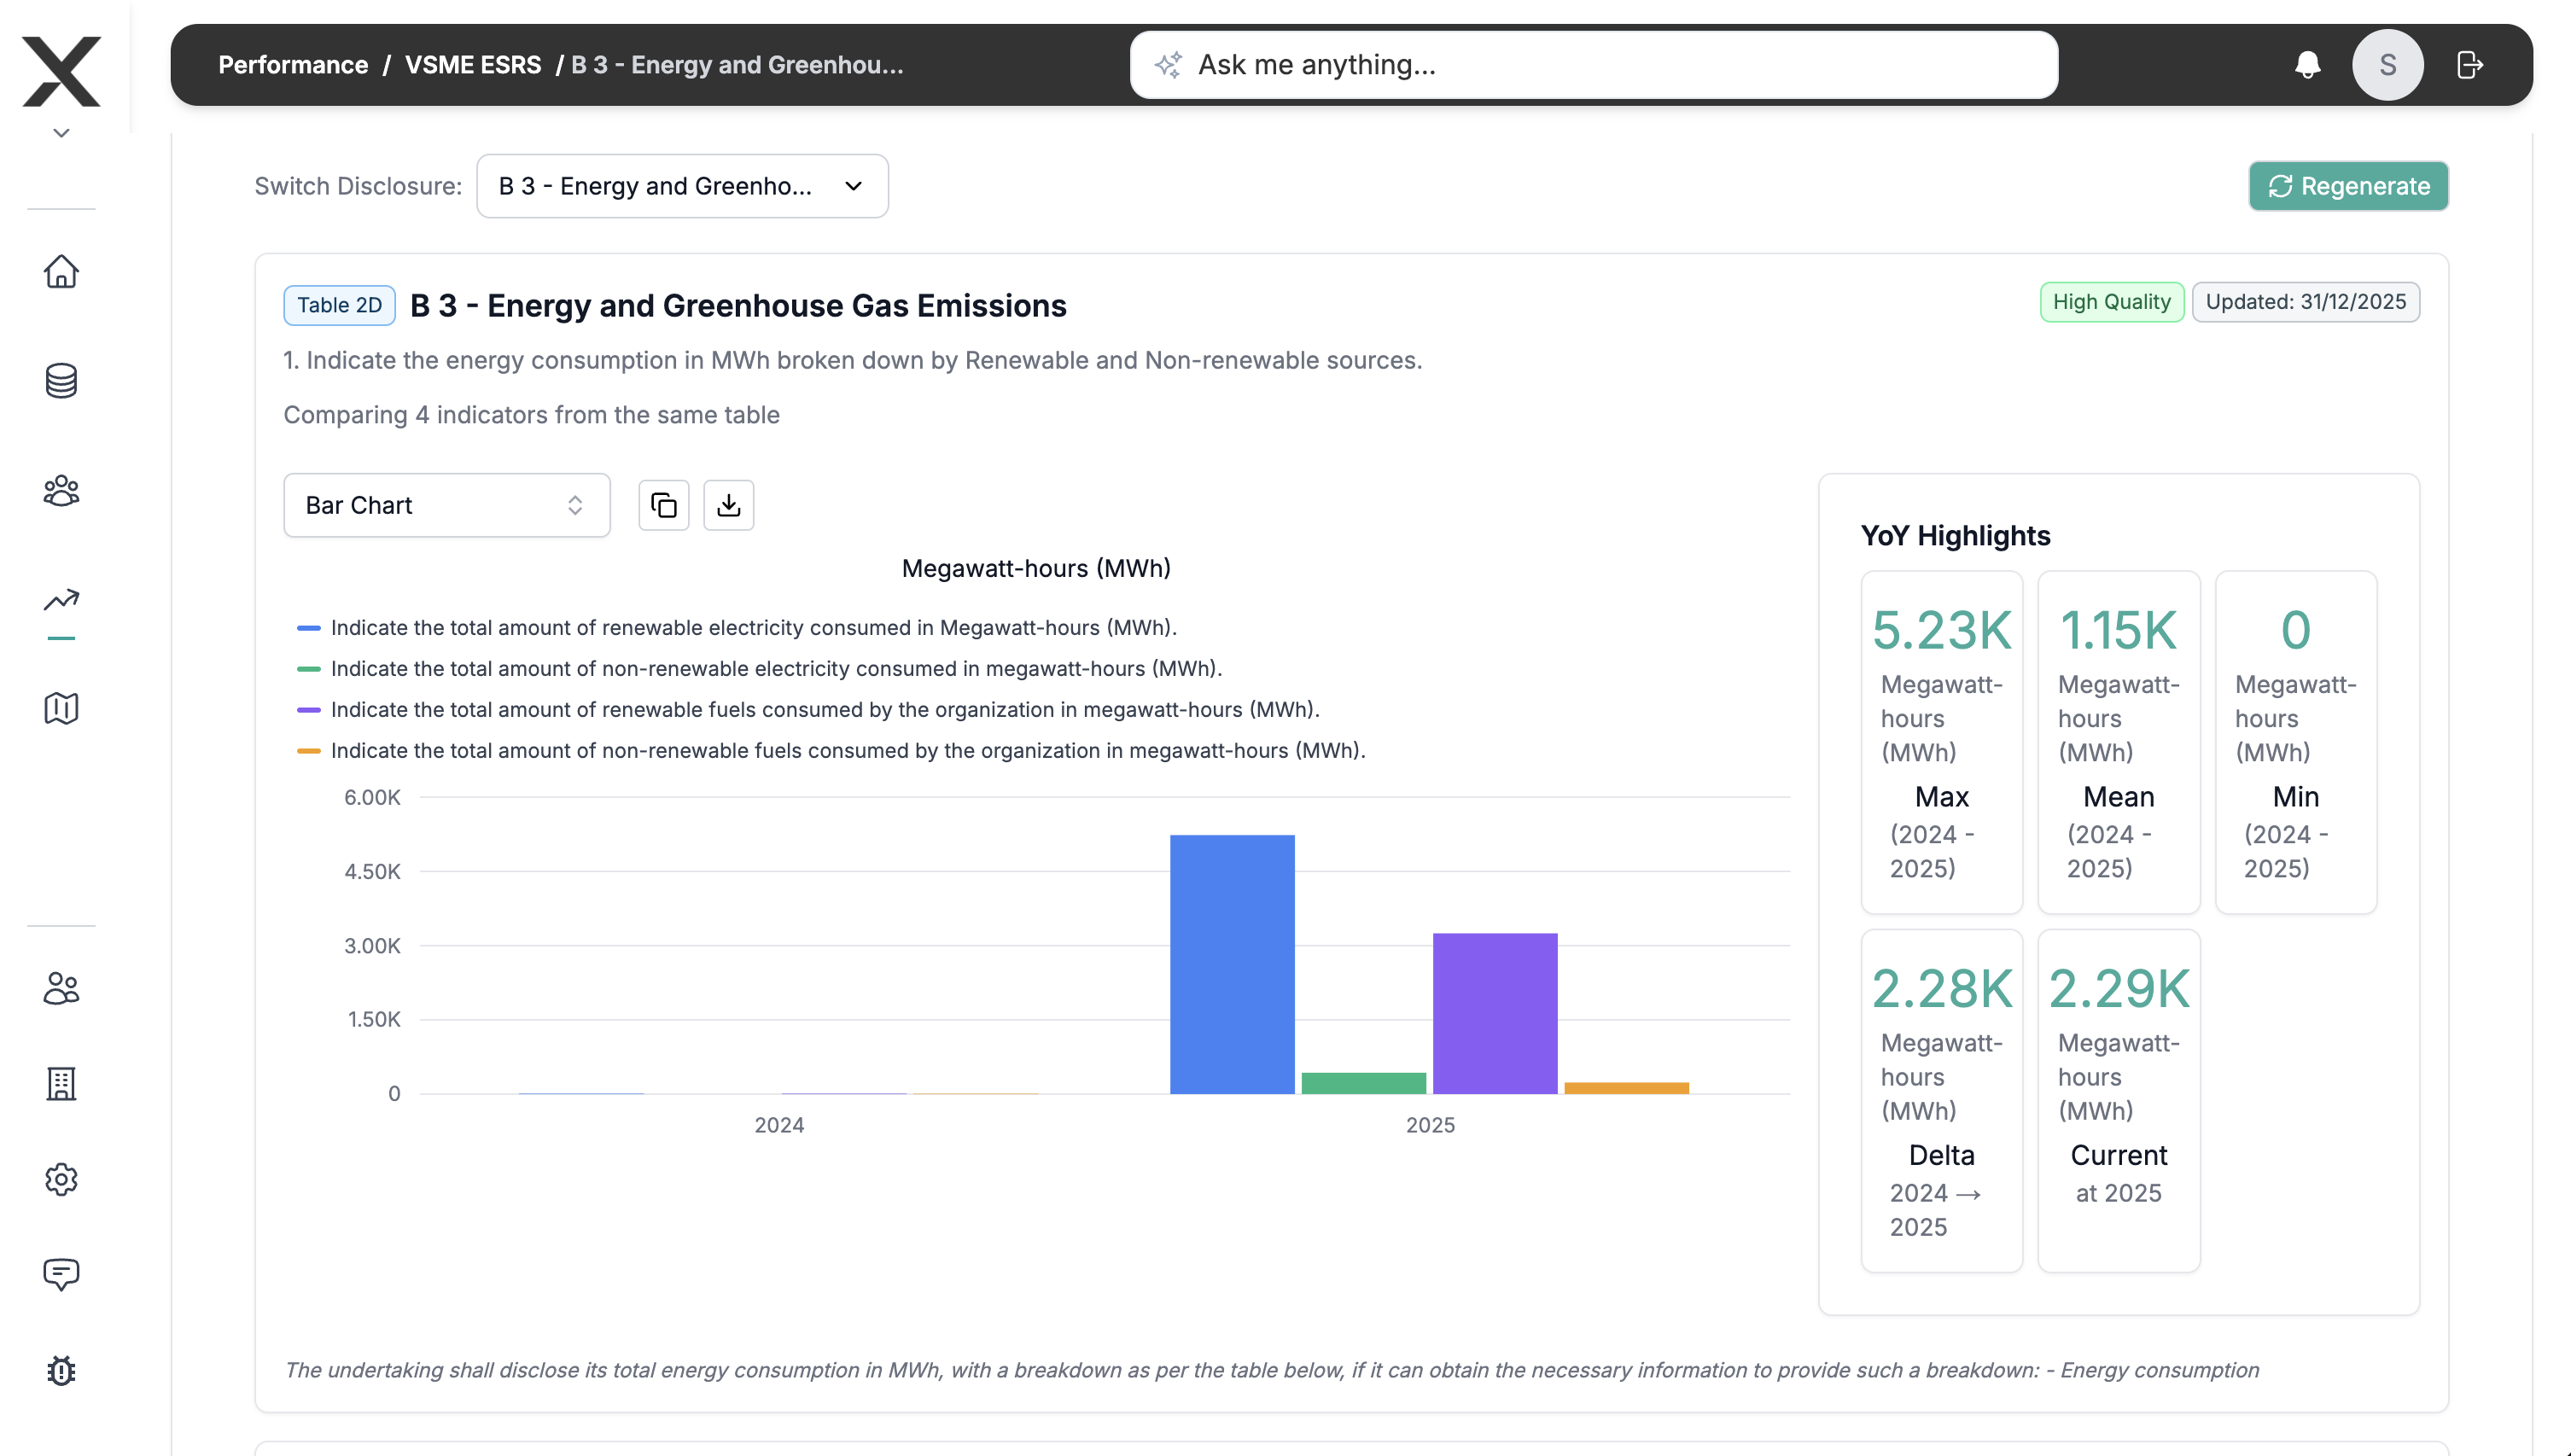
📊 Simple dashboards
Visual views of the data you have already inserted:
- Charts for key indicators over time.
- Basic summaries that show direction (up, down, stable).
🤖 AI‑assisted insights
Some views also include insight cards generated by our ESG agents to highlight risks, gaps and opportunities based on your data.

For more about how these agents work, see the Multi‑Agent ESG AI System.
How to use this module
- Make sure you have already inserted data in Reports & Data Input.
- Open the Monitoring & Improvement section.
- Explore the available charts and insights related to your data.
Why this module is important
- It helps you see if your actions are moving in the right direction.
- It makes it easier to explain progress to management and stakeholders.
Main outputs
- Simple visualizations of your ESG data.
- Insights that can feed your roadmap and future actions.
Next steps
- Reports & Data Input - See where the data comes from.