Report Creation Guide
Create professional ESG reports that meet global standards and stakeholder expectations.
Overview
EXO.G's report editor helps you create clear ESG reports. This guide covers:
- Report structure and templates
- Using the editor
- Adding data and charts
- Generating reports
Report Types
Annual Sustainability Report
Comprehensive annual disclosure covering:
- Executive summary
- Material topics
- Performance data
- Targets and progress
- Governance structure
- Stakeholder engagement
GRI Report
Following GRI Standards structure:
- General Disclosures (GRI 2)
- Material Topics (GRI 3)
- Topic-Specific Standards (GRI 200, 300, 400)
- Topic-specific disclosures
ESRS Report
For EU CSRD compliance:
- Double materiality assessment
- ESRS disclosures (E, S, G)
- Data tables
- Forward-looking information
TCFD Report
Climate-focused disclosure:
- Governance
- Strategy
- Risk Management
- Metrics and Targets
Custom Reports
Create your own structure:
- Board reports
- Investor presentations
- Quarterly updates
- Topic-specific deep dives
Getting Started with Reports
Step 1: Choose Template
- Go to Reports in your project
- Click "New Report"
- Select template:
- GRI Standards
- ESRS
- TCFD
- Custom
- Blank
- Click "Create Report"
Step 2: Configure Report
Set basic details:
- Report title (e.g., "2024 Sustainability Report")
- Reporting period (auto-filled from project)
- Standards (can select multiple)
- Language (English, Portuguese, etc.)
- Publication date
Step 3: Build Structure
Using templates:
- Pre-populated section structure
- Edit section titles
- Add/remove sections as needed
- Reorder by drag-and-drop
Starting from scratch:
- Click "Add Section"
- Choose section type (text, data, chart, table)
- Name your section
- Build progressively
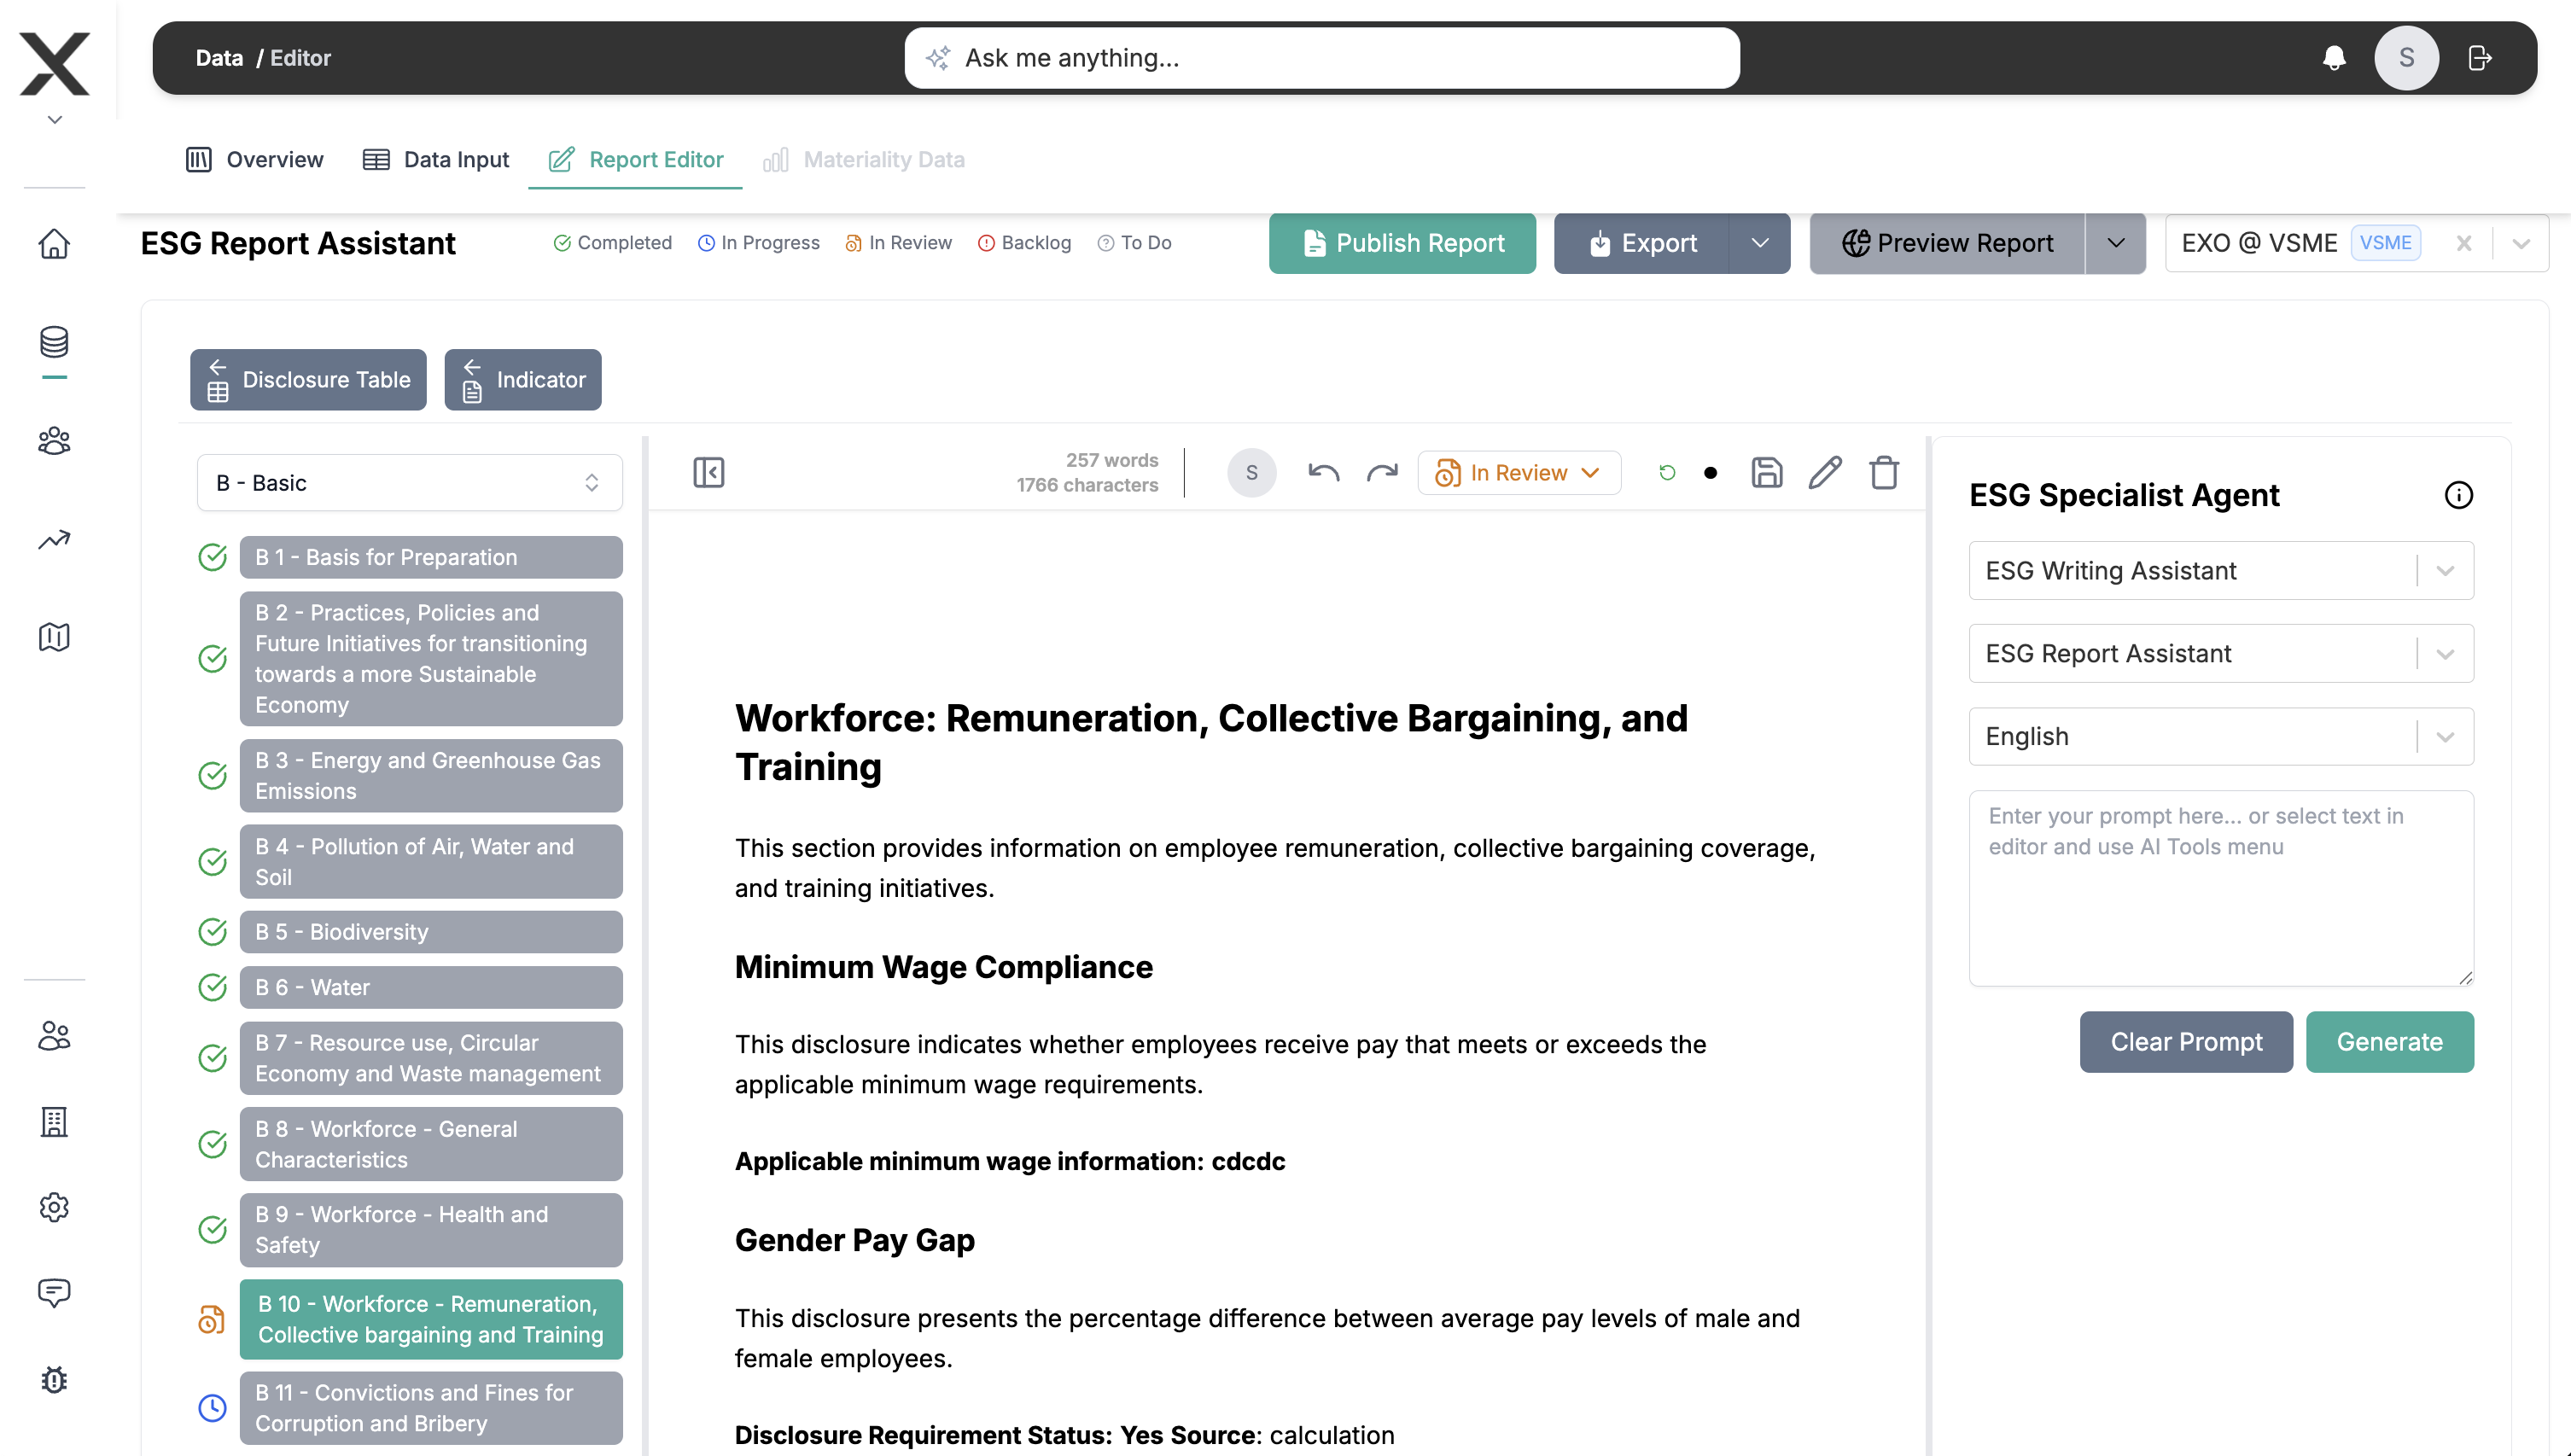
Using the WYSIWYG Editor
Text Editing
Formatting:
- Bold, italic, underline
- Headings (H1, H2, H3)
- Bullet lists and numbered lists
- Quotes and callouts
- Links and footnotes
Styling:
- Font size and color
- Text alignment
- Line spacing
- Indentation
Adding Elements
Data References:
- Insert data points from Core
- Auto-update when data changes
- Format numbers and units
- Add trend indicators
Charts and Graphs:
- Line charts (trends)
- Bar charts (comparisons)
- Pie charts (proportions)
- Tables (detailed data)
- Linked to your data
Images:
- Upload photos
- Add diagrams
- Insert logos
- Resize and position
Custom Components:
- Materiality matrix
- Value chain diagram
- Risk heat map
- Target progress tracker
Working with Data
Insert Data Points
- Place cursor where you want data
- Click "Insert" → "Data Point"
- Select indicator (e.g., "Total GHG Emissions")
- Choose format:
- Number only
- Number with unit
- Change from previous year
- Trend indicator
- Data auto-updates if source changes
Add Charts
- Click "Insert" → "Chart"
- Select chart type
- Choose data source:
- Single indicator over time
- Multiple indicators comparison
- Category breakdown
- Customize:
- Colors and style
- Labels and legends
- Axis ranges
- Chart updates automatically
Create Tables
- Click "Insert" → "Table"
- Select template or custom
- Define columns:
- Indicator name
- Units
- Values by year
- Targets
- Notes
- Link to data sources
- Format styling
Report Sections
Essential Sections
Executive Summary:
- Key highlights
- Major achievements
- Challenges faced
- Future commitments
- Leadership message
About Our Organization:
- Company profile
- Business model
- Products/services
- Geographic presence
- Organizational structure
Materiality Assessment:
- Process description
- Stakeholders engaged
- Material topics identified
- Prioritization matrix
- Topic definitions
Performance Data:
- Environmental metrics
- Social indicators
- Governance data
- Year-over-year trends
- Target progress
Governance & Strategy:
- Board oversight
- Management approach
- Policies and commitments
- Risk management
- Future strategy
Stakeholder Engagement:
- Stakeholder identification
- Engagement methods
- Key concerns
- How we responded
- Ongoing dialogue
Value Chain:
- Supply chain overview
- Supplier engagement
- Value chain impacts
- Collaboration initiatives
Assurance Statement (if applicable):
- Scope of assurance
- Assurance provider
- Statement from auditor
- Limitations
Collaboration Features
Multi-User Editing
- Multiple people can work simultaneously
- See who's online
- Real-time updates
- Section-level locking to prevent conflicts
Comments & Feedback
- Add comments to any section
- @mention team members
- Thread discussions
- Resolve when addressed
Approval Workflow
- Author completes section
- Mark as "Ready for Review"
- Reviewer provides feedback
- Author addresses comments
- Final approval
- Lock section
Version Control
- Save draft versions
- Name versions (e.g., "Draft 1", "Board Review")
- Compare versions
- Restore previous version if needed
Quality Checklist
Before publishing, verify:
Completeness
- All required sections included
- Data points up-to-date
- Charts displaying correctly
- Images loading properly
- Links working
Accuracy
- Data matches source
- Calculations correct
- Units consistent
- Trends accurate
- No typos
Compliance
- Follows selected standard(s)
- Required disclosures present
- Materiality explained
- Forward-looking statements appropriate
- Legal review completed (if required)
Presentation
- Formatting consistent
- Charts readable
- Images high quality
- Table of contents accurate
- Page numbers correct
Export & publishing
Export to Canva (available today)
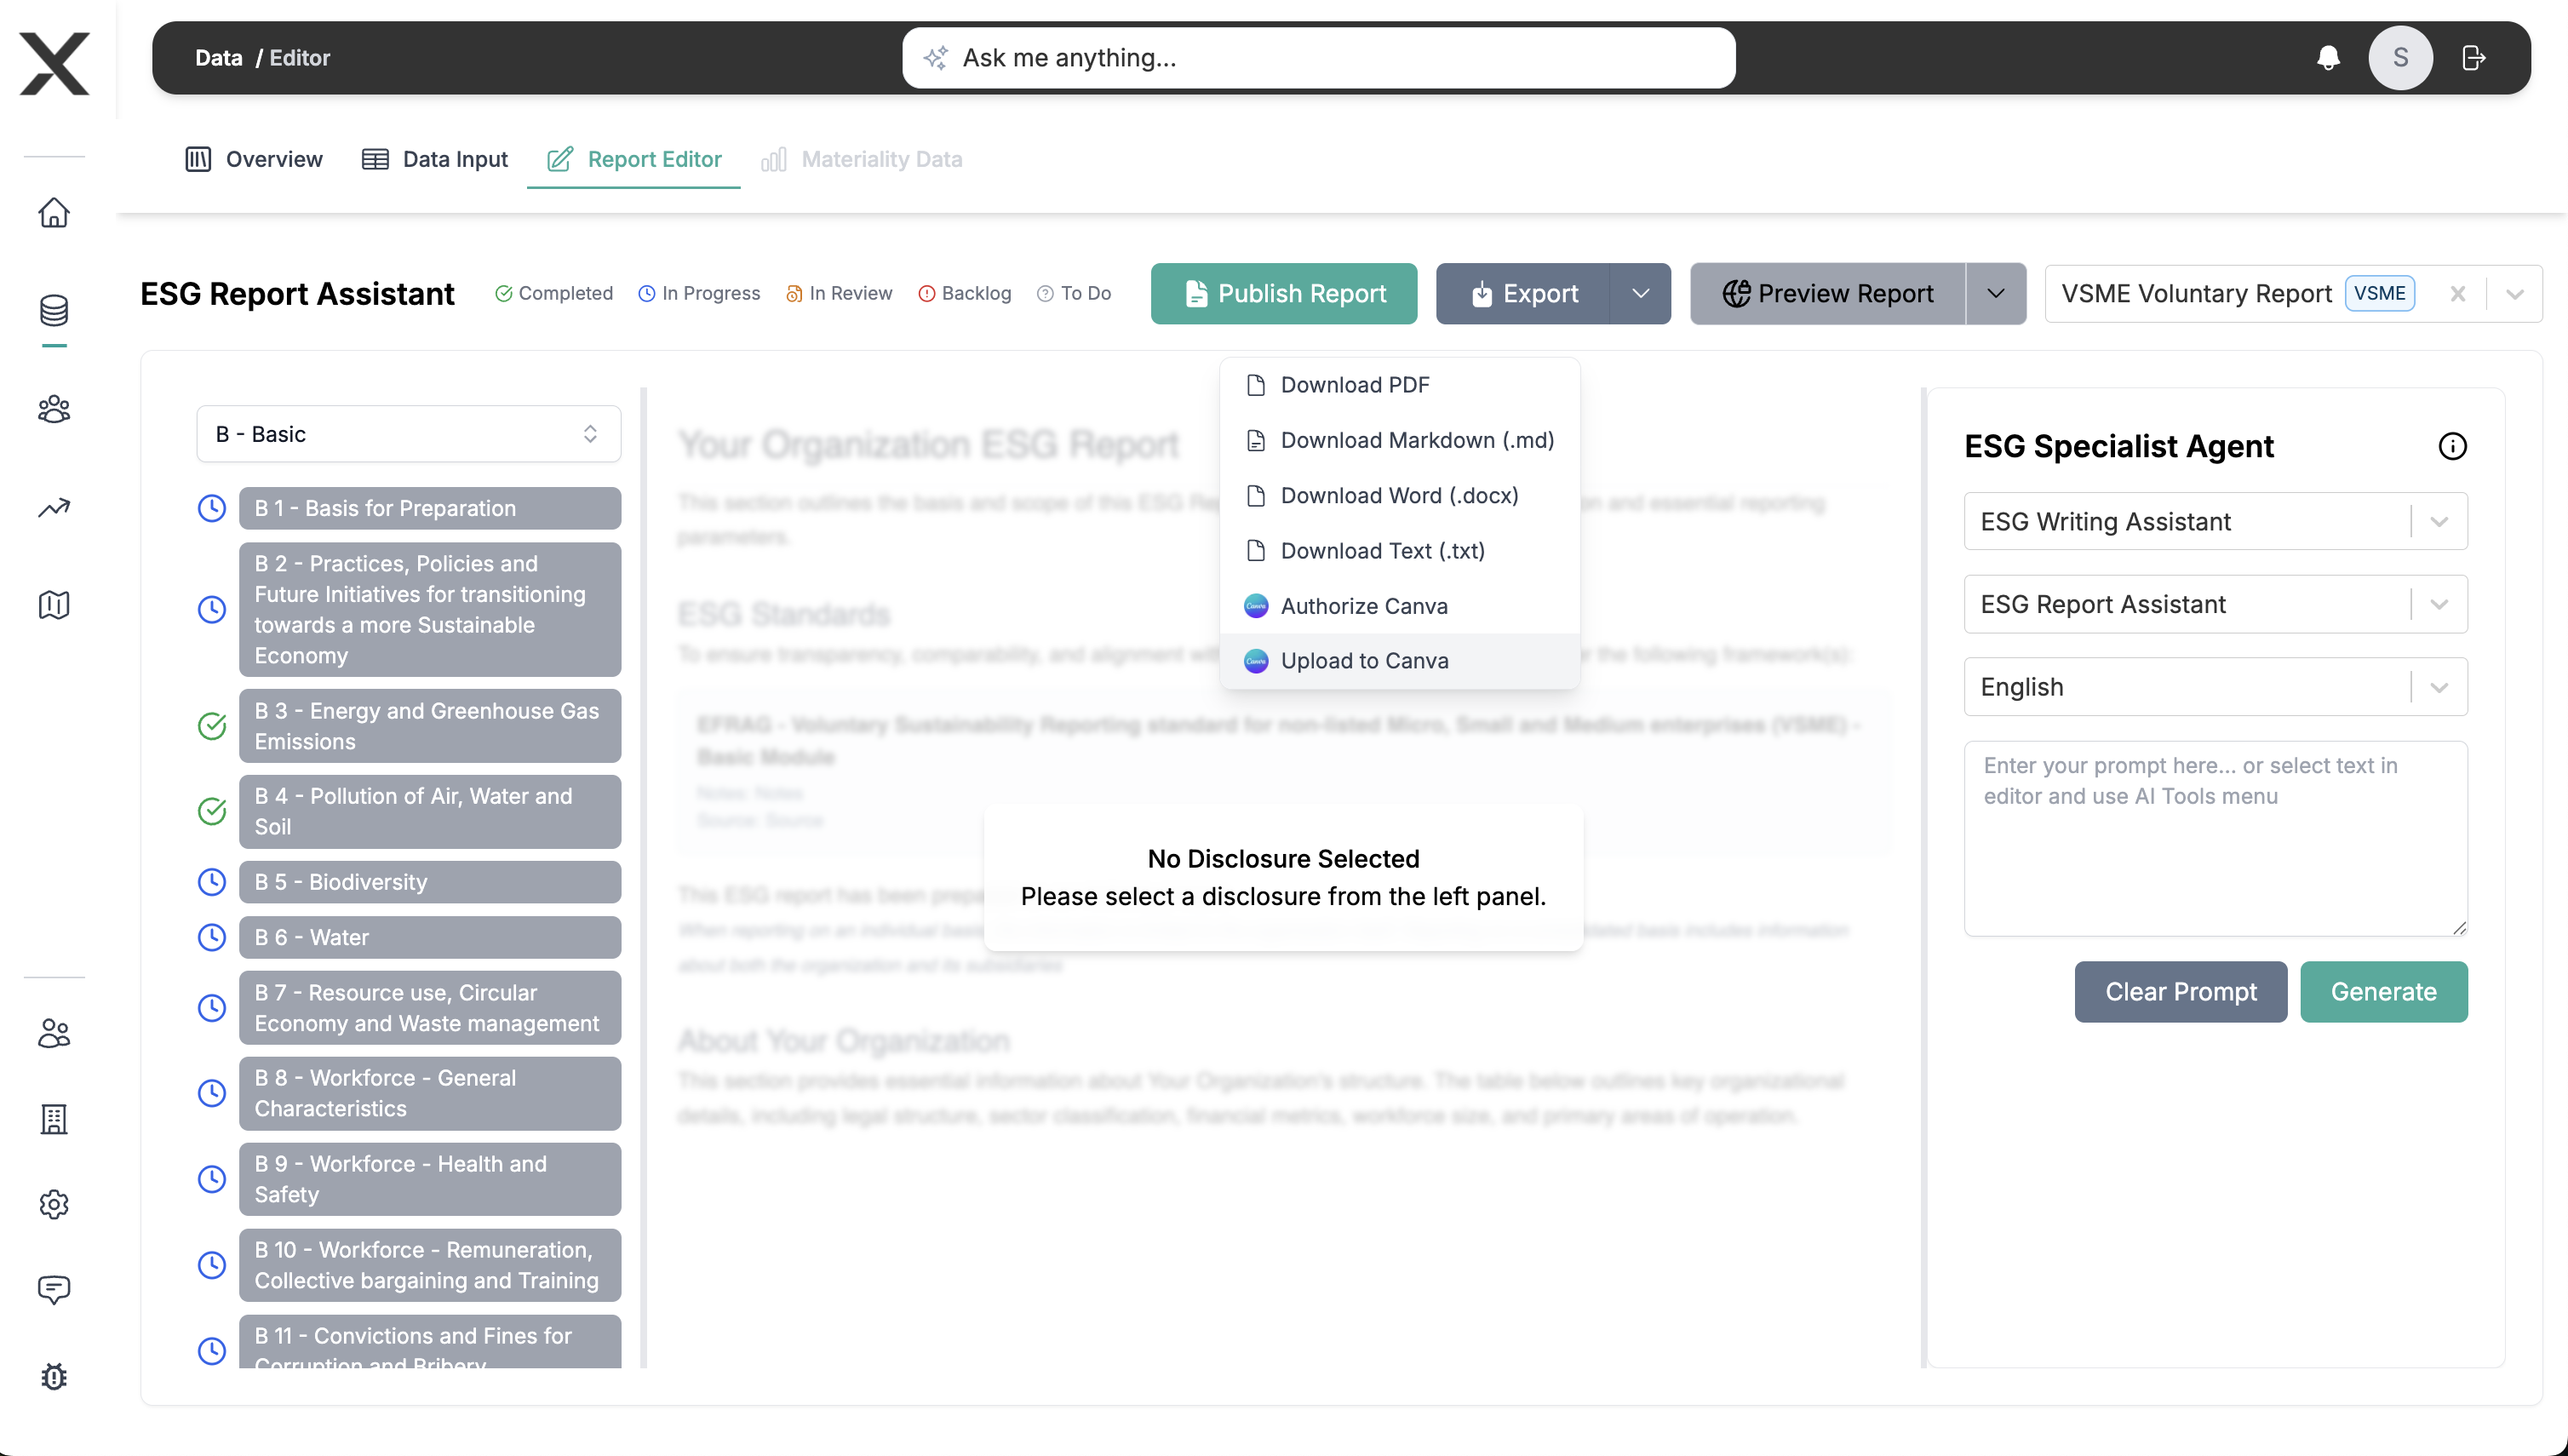
- Send your report content to Canva.
- Use Canva to design the final layout and visuals.
from EXO.G) are planned for future versions of the platform. :::
Best Practices
Start Early
- Begin report structure early in period
- Update sections throughout the year
- Don't wait until deadline
- Build progressively
Focus on Narrative
- Data tells "what"
- Narrative explains "why" and "so what"
- Connect to strategy
- Show progress and challenges
Make it Visual
- Use charts over tables where possible
- Include photos of initiatives
- Add infographics for key stats
- Break up text with visuals
Tell a Story
- Logical flow from section to section
- Connect material topics to performance
- Explain context and actions
- Show improvement over time
Be Transparent
- Acknowledge challenges
- Explain gaps or missing data
- Discuss targets not met
- Show commitment to improvement
Tips for Different Standards
GRI Focus
- Topic-by-topic structure
- Management approach for each topic
- Quantitative and qualitative disclosures
- Stakeholder engagement prominent
ESRS Focus
- Double materiality central
- Data tables prominent
- Forward-looking information
- Value chain coverage essential
TCFD Focus
- Climate scenario analysis
- Financial implications
- Governance oversight
- Metrics and targets clear
Common Questions
Can I use multiple templates?
Yes! You can start with one template and add sections from others. Mix and match based on your needs.
How do I ensure data stays current?
Data linked to Core auto-updates. Charts refresh automatically. Just keep your Core data current.
Can I customize the template?
Absolutely! Add, remove, or reorder sections. Change colors and fonts. Make it match your brand.
What if I need to translate the report?
Create language versions. Most content can be copied and translated. Data auto-displays in localized format.
How do I handle confidential information?
Use access controls to limit who sees drafts. Redact sensitive info before publishing. Create internal vs. external versions.
Next Steps
- Performance Dashboard - Analyze your data
- Materiality Assessment - Identify topics to report
- Integration Guide - Understand reporting workflow
Need Help?
- In-app help: Click the ? icon
- Video tutorials: Watch demos
- Support: support@exo.com