Reports & Data Input
The Reports & Data Input module is where you collect ESG data and create your ESG reports.
What is this module?
This is the place where you:
- Collect data - Insert your ESG metrics
- Manage projects - Organize work by reporting period
- Create reports - Build your ESG report content
Key Capabilities
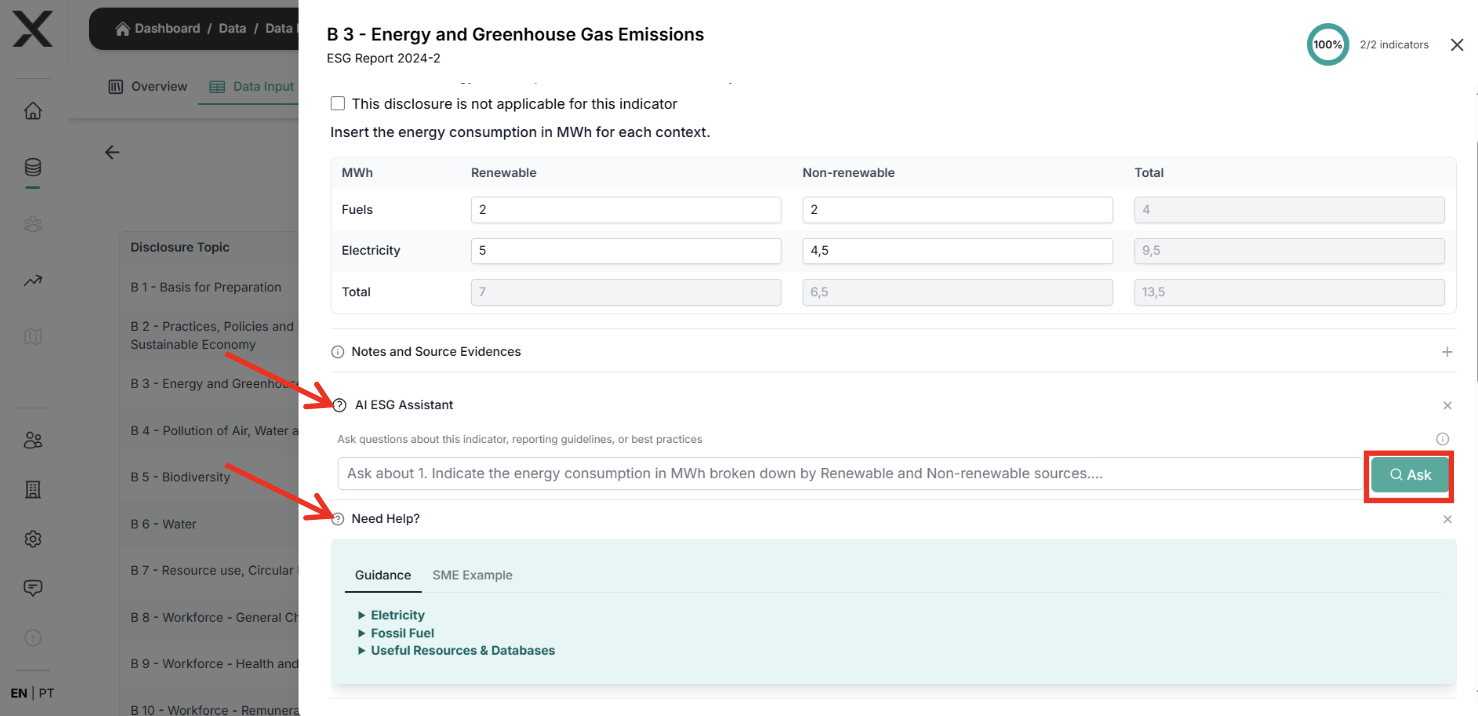
📝 Data Input
Enter ESG data across all categories:
- Environmental: Emissions, energy, water, waste
- Social: Labor practices, community impact, diversity
- Governance: Ethics, compliance, board composition
✍️ Report Creation
Create and structure your reports:
- Create reports for each project or period
- Organize sections and content
- Connect narrative and data
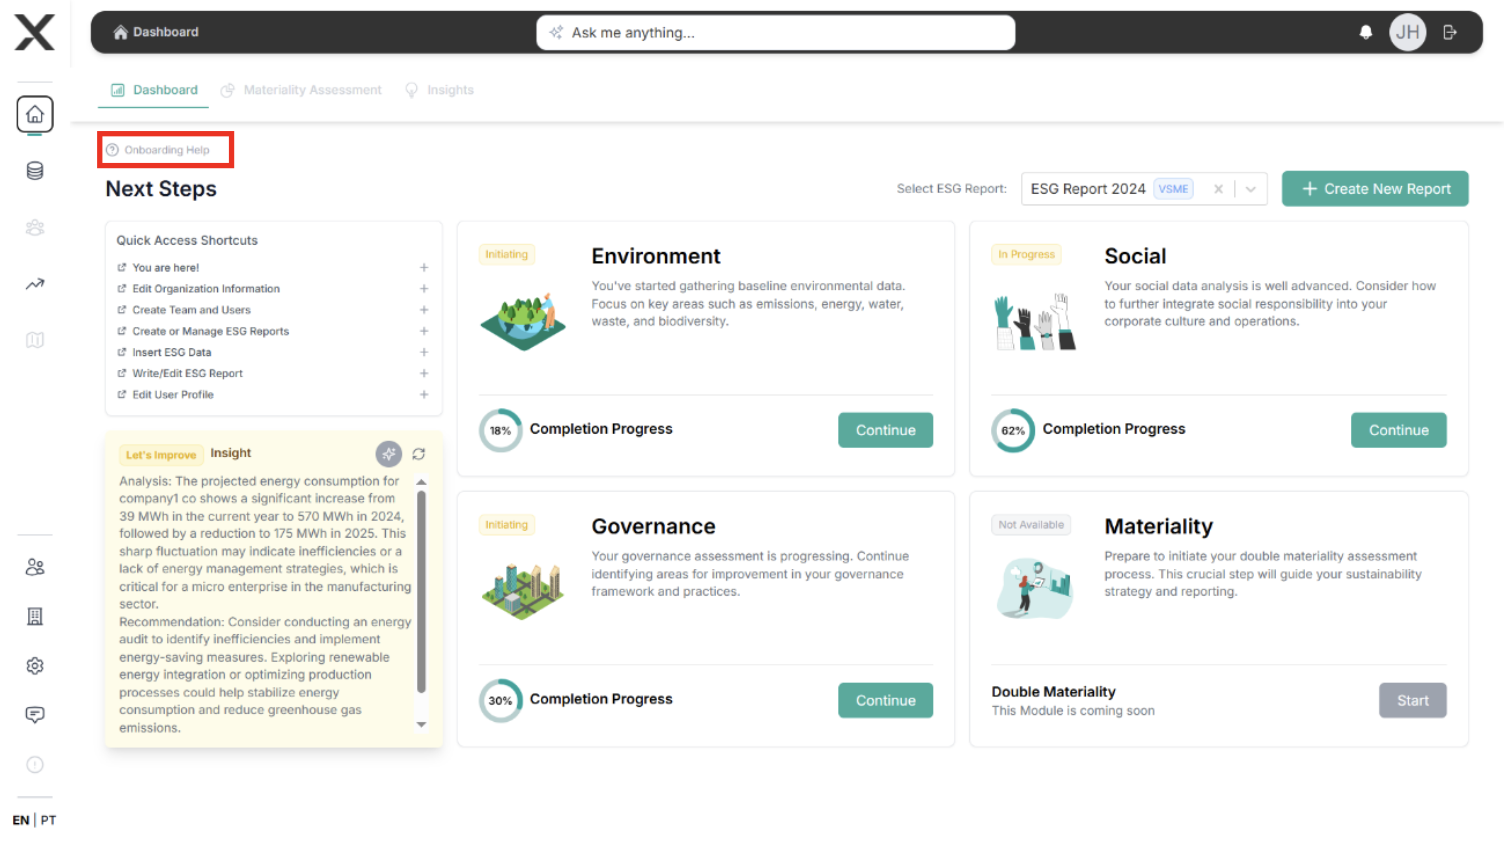
How to use this module
Step 1: Create a project
- Open the platform and go to your main dashboard.
- Create a project for the reporting period you want to work on.
- Give the project a clear name (for example, "ESG Report 2024").
Step 2: Insert your data
- Inside the project, go to the Data area.
- Select the category you want to work on.
- Add your data point by data point.
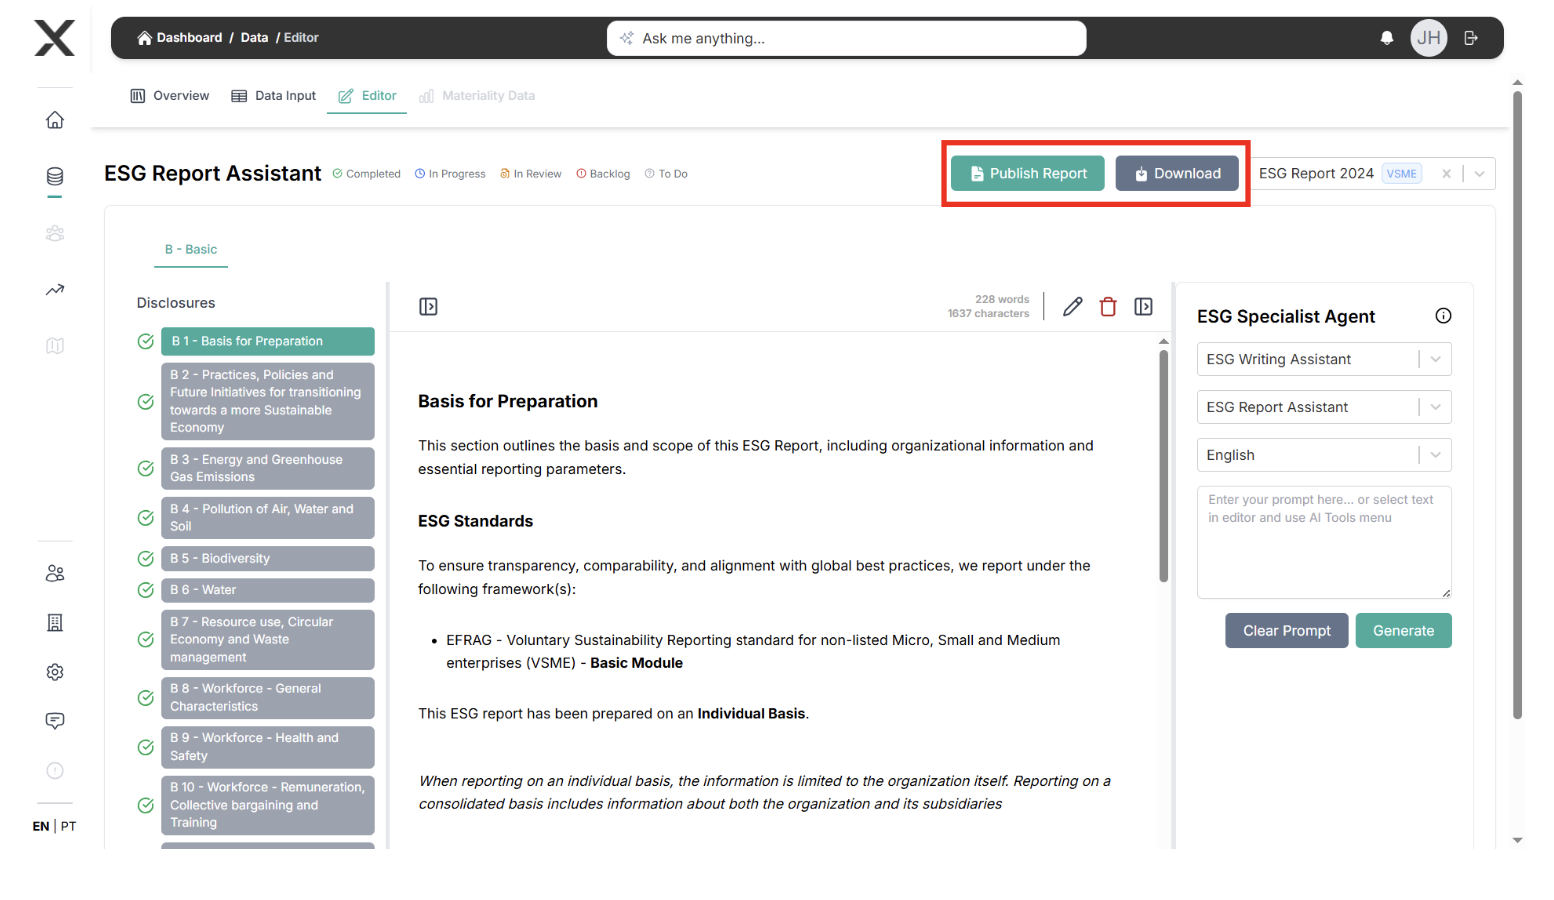
Step 3: Build your report
- Go to the Reports area of the project.
- Create a report.
- Add sections and write your content.
Integration with other features
The Reports & Data Input module connects with all other EXO.G features:
→ Monitoring & Improvement
Data you enter here feeds the performance views.
Example: Enter GHG emissions → See them reflected in Monitoring & Improvement.
→ Materiality
Information from this module helps identify material topics during assessments.
Example: High water usage data → Flags water as a topic to assess in Materiality.
→ Value Chain
Projects and data points can be linked to value chain entities.
→ Risk Management
Mitigation actions you define can be tracked as part of your projects here.
Why this module is important
- It is where your ESG work becomes concrete and structured.
- It keeps your data and narrative in one place.
- It prepares the content that will be reused in other modules.
Main outputs
- A project with your ESG data organized.
- One or more ESG reports ready for design and sharing.
Next steps
- Data Input Guide - How to insert data in practice.
- Report Creation Guide - How to build your first report.
- Monitoring & Improvement - How to see your data over time.