Introduction to EXO.G Platform
EXO.G is a practical ESG platform that helps you move from data to material topics, risks, actions and finally a clear ESG report.
This page gives you the essence of how the platform is organized and shows short videos of the main flows so you can understand EXO.G without reading the entire documentation.
See the journey in 60 seconds
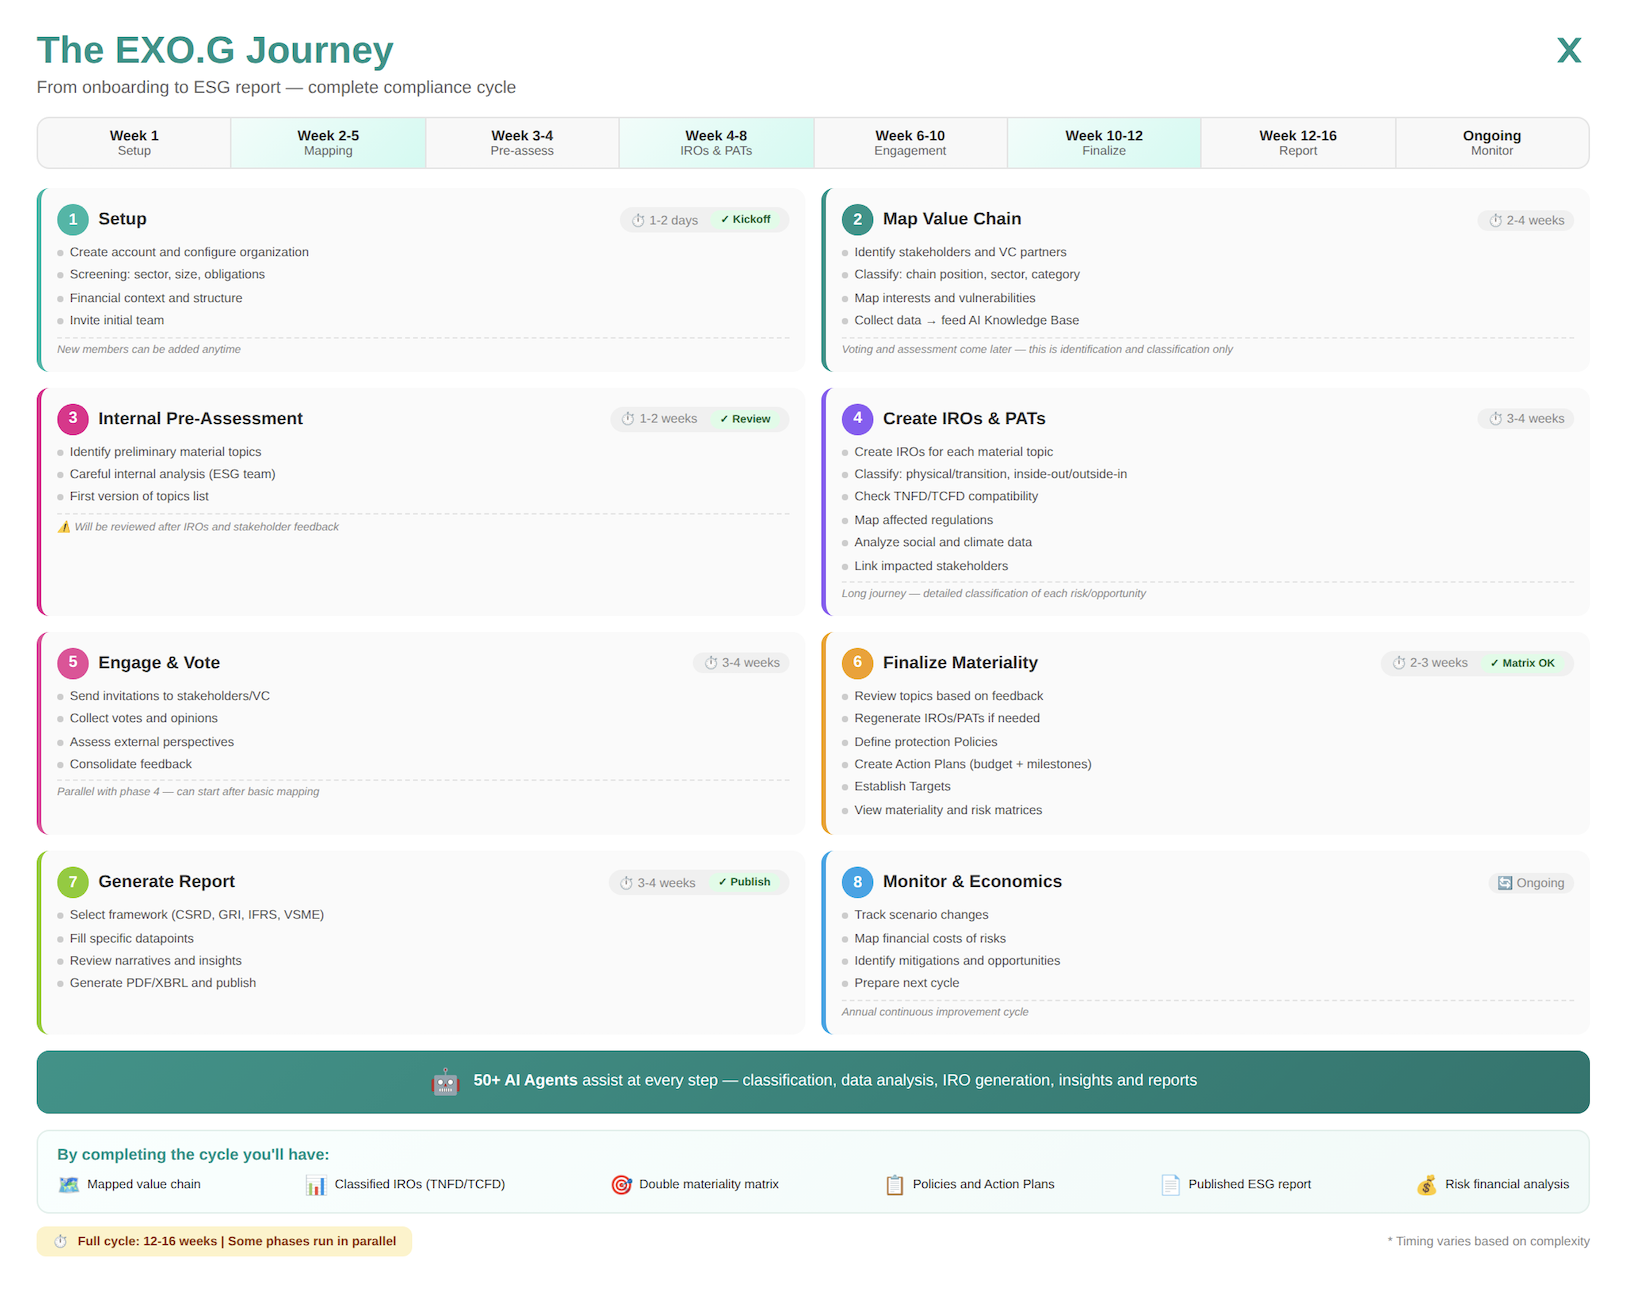
From onboarding to your first published ESG report — a complete compliance cycle in 12-16 weeks.
Some phases run in parallel Phases 4 (IROs) and 5 (Engagement) can be executed simultaneously, reducing the total cycle time.
Timeline Overview
| Phase | Name | Weeks | Duration | Checkpoint |
|---|---|---|---|---|
| 1 | Setup | 1 | 1-2 days | ✅ Kickoff |
| 2 | Map Value Chain | 2-5 | 2-4 weeks | — |
| 3 | Internal Pre-Assessment | 3-4 | 1-2 weeks | ✅ Review |
| 4 | Create IROs & PATs | 4-8 | 3-4 weeks | — |
| 5 | Engage & Vote | 6-10 | 3-4 weeks | — |
| 6 | Finalize Materiality | 10-12 | 2-3 weeks | ✅ Matrix OK |
| 7 | Generate Report | 12-16 | 3-4 weeks | ✅ Publish |
| 8 | Monitor & Economics | Ongoing | Continuous | ✅ Annual Cycle |
Phase 1: Setup
⏱️ Duration: 1-2 days
📅 Week: 1
✅ Checkpoint: Kickoff Complete
Initial onboarding configures your organization on the EXO.G platform. It's a quick, AI-guided process that establishes the foundation for your entire compliance cycle.
Key steps:
- Create account and configure organization (5 min)
- Initial screening questionnaire (15 min)
- Financial context and structure (10 min)
- Invite initial team (15 min)
Deliverables: Active platform account, complete organizational profile, initial team configured with permissions.
→ Detailed guide: Account & Organization Setup
Phase 2: Map Value Chain
⏱️ Duration: 2-4 weeks
📅 Weeks: 2-5
Complete mapping of your stakeholder ecosystem and value chain. This phase focuses on identification and classification — voting and assessment come later.
Key steps:
- Identify stakeholders and partners (2-4 hours)
- Classify each member (1-2 hours per 50 stakeholders)
- Map interests and vulnerabilities (30 min per critical stakeholder)
- Collect data and feed Knowledge Base (variable)
Deliverables: Complete list of registered stakeholders, classification by position/category/criticality, visual value chain map, Knowledge Base fed with partner data.
→ Detailed guide: Map Value Chain & Pre-Assessment
Phase 3: Internal Pre-Assessment
⏱️ Duration: 1-2 weeks
📅 Weeks: 3-4
✅ Checkpoint: Internal Review
Preliminary internal materiality assessment. The ESG team identifies candidate material topics before creating IROs and engaging stakeholders.
Key steps:
- Identify preliminary material topics (1-2 hours)
- Careful internal analysis workshop (2-4 hours)
- First version of topics list (1 hour)
Deliverables: Preliminary material topics list (10-20 topics), internal analysis documentation, questions list for next phases.
→ Detailed guide: Map Value Chain & Pre-Assessment
Phase 4: Create IROs & PATs
⏱️ Duration: 3-4 weeks
📅 Weeks: 4-8
Detailed creation and classification of Impacts, Risks, and Opportunities (IROs) for each material topic. This is one of the longest and most important phases of the cycle.
Key steps:
- Create IROs for each material topic (1-2 hours per topic)
- Classify each IRO (30 min per IRO)
- Check TNFD/TCFD compatibility (15 min per IRO)
- Map affected regulations (15 min per IRO)
- Analyze social and climate data (variable, AI-automated)
- Link impacted stakeholders (15 min per IRO)
Deliverables: Complete IRO list for each material topic, detailed classification, TNFD/TCFD mapping, link to applicable regulations, connection with impacted stakeholders.
AI as copilot The 50+ AI agents assist throughout this phase — suggesting IROs, auto-classifying, identifying regulations, and generating preliminary analyses.
Phase 5: Engage & Vote
⏱️ Duration: 3-4 weeks
📅 Weeks: 6-10
Stakeholder engagement and collection of their perspectives on material topics. This phase can run in parallel with Phase 4.
Key steps:
- Prepare engagement (2-4 hours)
- Send invitations (30 min, automated)
- Collect votes and opinions (2-3 weeks wait time)
- Consolidate feedback (2-4 hours)
Deliverables: Participation rate report, consolidated voting results, qualitative comments analysis, list of stakeholder-suggested topics.
→ Detailed guide: Reassess Topics with Feedback
Phase 6: Finalize Materiality
⏱️ Duration: 2-3 weeks
📅 Weeks: 10-12
✅ Checkpoint: Materiality Matrix Approved
Consolidation of all previous analyses to finalize the materiality matrix and define policies, actions, and targets.
Key steps:
- Review topics based on feedback (2-4 hours)
- Regenerate IROs/PATs if necessary (variable)
- Define protection Policies (1-2 hours per policy)
- Create Action Plans (2-3 hours per topic)
- Establish Targets (1-2 hours)
- View matrices and get approval (1-2 hours)
Deliverables: Finalized double materiality matrix, documented policies for priority topics, Action Plans with budget and milestones, short/medium/long-term targets, formal leadership approval.
→ Detailed guide: Implement Policies, Action Plans & Targets
Phase 7: Generate Report
⏱️ Duration: 3-4 weeks
📅 Weeks: 12-16
✅ Checkpoint: Report Published
ESG report generation per chosen framework, review, approval, and publication.
Key steps:
- Select framework (15 min)
- Fill datapoints (1-2 weeks)
- Review narratives and insights (2-4 hours)
- Generate and publish (1-2 days)
Deliverables: Complete ESG report in PDF, XBRL file (if applicable), portal publication, stakeholder communication.
→ Detailed guide: Draft the ESG Report | Generate Report & Next Roadmap
Phase 8: Monitor & Economics
⏱️ Duration: Ongoing
📅 Period: Post-publication
✅ Checkpoint: Annual Cycle
Continuous scenario monitoring, financial risk analysis, and preparation for the next cycle.
Key steps:
- Track scenario changes (weekly 15 min)
- Map financial costs of risks (monthly/quarterly)
- Identify mitigations and opportunities (quarterly)
- Prepare next cycle (3-1 months before)
Deliverables: Active monitoring dashboards, configured alerts, quarterly progress reports, updated financial analysis, roadmap for next cycle.
→ Detailed guide: Monitoring & Insights | Assess Value Chain Financial Risks
Checkpoint Summary
| Checkpoint | Phase | Week | What Gets Approved/Delivered |
|---|---|---|---|
| ✓ Kickoff | 1 | 1 | Account active, team onboarded, organization configured |
| ✓ Review | 3 | 4 | Preliminary material topics list validated by ESG team |
| ✓ Matrix OK | 6 | 12 | Double materiality matrix + risk matrix approved by leadership |
| ✓ Publish | 7 | 16 | ESG report published (PDF/XBRL) and shared with stakeholders |
Continuous Cycle Phase 8 (Monitor & Economics) runs continuously after publication, preparing for the next annual cycle.
Tips for Success
- Start early — don't wait for regulatory deadlines to begin
- Involve leadership — executive support accelerates approvals
- Use the AI — let the agents do the heavy lifting
- Parallelize — phases 4 and 5 can run simultaneously
- Document everything — records for audits
- Communicate — keep stakeholders informed about progress
- Iterate — the first version doesn't need to be perfect
Flexible Journeys for Every Need You don't need to follow the complete 12-16 week cycle. EXO.G adapts to your current priorities:
- Only stakeholder mapping? Use just Phase 2 (Value Chain) for real-time follow-up
- Only materiality assessment? Focus on Phases 3-5 (Pre-Assessment → IROs → Engagement)
- Only risk management? Jump to Phase 4 (IROs & PATs) and Phase 8 (Monitor)
- Only reporting & data? Use Phase 7 (Generate Report) with basic data input
All features are complementary. Together they create the most complete ESG journey, but you can start small and expand when ready. It's your platform, on your behalf.
Start with the core modules
- Reports & Data Input – create a project, insert ESG data point by point, and shape the report narrative that everyone will eventually read.
- Risk Assessment & Value Chain – map stakeholders/entities, identify impacts, risks and opportunities (IROs), and capture the justification behind each topic.
- Monitoring & Improvement (Performance & Insights) – review dashboards, trends and AI insight cards so reporting turns into an ongoing improvement loop.
- Collaboration – invite people, assign roles and discuss everything (data, IROs, PAT items, roadmap tasks) exactly where the work happens.
Quick video tour
Insert data
Run materiality assessment
Map value chain entities
Create tasks and collaborate with your team on the ESG roadmap
Use AI assistance for Policy, Action Plans and Targets preparation
If you watch these videos and read this page, you already understand the main modules and flows of EXO.G. You can then go straight to the getting started guide if you want step‑by‑step details.
Common Questions
Do I need to follow all 8 phases?
No! The 8-phase journey represents the gold standard based on IFRS, CSRD, CSDDD (ESRS, VSME), SASB, GRI, and our in-house expertise. But you can adapt it to your needs.
Can I skip materiality and go straight to reporting?
Yes, but not recommended. You can collect data and generate reports without materiality assessment. However, without materiality:
- You won't know which topics truly matter to your stakeholders
- Your report may lack strategic focus
- Future continuous improvement will be harder
Best practice: Do at least a simplified materiality (Phase 3) before reporting.
Can I do materiality outside EXO.G and import results?
Yes! If you've already completed materiality assessment externally:
- Jump directly to Phase 4 (Create IROs) or Phase 7 (Generate Report)
- Import your material topics list
- Continue from there
Do I need to map my entire value chain?
Not necessarily. Value chain mapping (Phase 2) is essential for:
- CSRD compliance (mandatory for EU companies)
- Understanding Scope 3 emissions
- Comprehensive risk assessment
For simpler needs: You can skip Phase 2 and focus only on direct operations.
Can I do the phases in a different order?
Some flexibility exists:
- ✅ Phases 4 & 5 can run in parallel (IROs + Engagement)
- ✅ Phase 8 starts after Phase 7 (Monitor after Report)
- ⚠️ Phase 3 should come before Phase 4 (Pre-assessment before IROs)
- ⚠️ Phase 6 needs Phases 4 & 5 complete (Finalize needs IROs + feedback)
What if I only need risk management?
Go directly to Phase 4 (Create IROs & PATs) and Phase 8 (Monitor & Economics). You can manage risks without the full reporting cycle.
What if I only need stakeholder engagement?
Use Phase 2 (Map Value Chain) and Phase 5 (Engage & Vote) for real-time stakeholder follow-up and consultation.
How does this align with regulations?
Our journey is built on:
- CSRD/ESRS (EU Corporate Sustainability Reporting Directive)
- IFRS S1/S2 (International sustainability standards)
- CSDDD (Corporate Sustainability Due Diligence Directive)
- GRI (Global Reporting Initiative)
- SASB (Sustainability Accounting Standards Board)
- VSME (Voluntary SME standard)
Following the complete journey ensures maximum compliance with all major frameworks.
Will skipping phases affect quality?
Possibly. The complete journey ensures:
- ✅ Stakeholder-validated priorities
- ✅ Comprehensive risk assessment
- ✅ Regulatory compliance
- ✅ Continuous improvement capability
Skipping phases may result in:
- ⚠️ Less strategic focus
- ⚠️ Gaps in compliance
- ⚠️ Harder to improve over time
Our recommendation: Start with the full journey once, then optimize in future cycles based on your learnings.
How long does each phase really take?
Times vary based on:
- Organization size and complexity
- Data availability
- Team experience
- Stakeholder responsiveness
Typical ranges:
- Small companies (< 50 employees): 8-12 weeks total
- Medium companies (50-250): 12-16 weeks total
- Large companies (250+): 16-20 weeks total
Can I pause and resume the journey?
Yes! Each phase has clear deliverables. You can:
- Complete Phase 1-3, pause, then resume later
- Do Phases 1-6 in Year 1, then Phase 7-8 in Year 2
- Work at your own pace
The platform saves your progress at every step.
Where to go next
- Overview & Video Tutorial – pick the short vs. full journey with a quick video.
- Short Path – Simple VSME Flow – fast and lightweight onboarding for SMEs.
- Medium & Large Corporate Journey – full materiality, value chain, PAT and monitoring guidance.
- Feature Modules Overview – deep dives into every module.
- Need help? Contact us at support@exo.com.